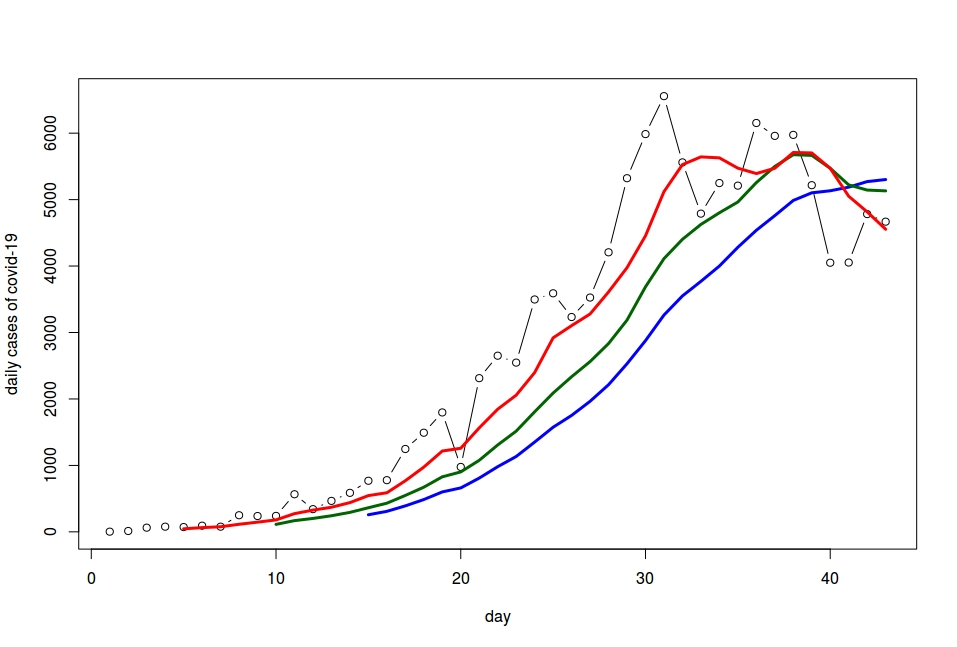
New daily cases of Covid-19, i.e. new daily recorded cases of the disease. The moving average taken over the last 5 days (in red) crosses the moving average over the last 10 days (green). Both, in turn, cross the moving average over the last 15 days (blue) from above. These curve intersections give us some cautious optimism.
------------------------------
When dealing with time series, moving average analyses can be useful in revealing possible trend changes. Moving averages can – although somewhat simplistically – approximate trends over several time horizons (short, medium, long period) using different lags (measured in days over which the moving average is calculated). For example, a short-term moving average (calculated over the last 5 days) that crosses a long-term moving average (calculated over the last 15 days) from above may be a sign that the until-then increasing trend has now shifted. Caution though. Moving average analyses are generally a tool to confirm results obtained with more sophisticated methods and models.
Nessun commento:
Posta un commento